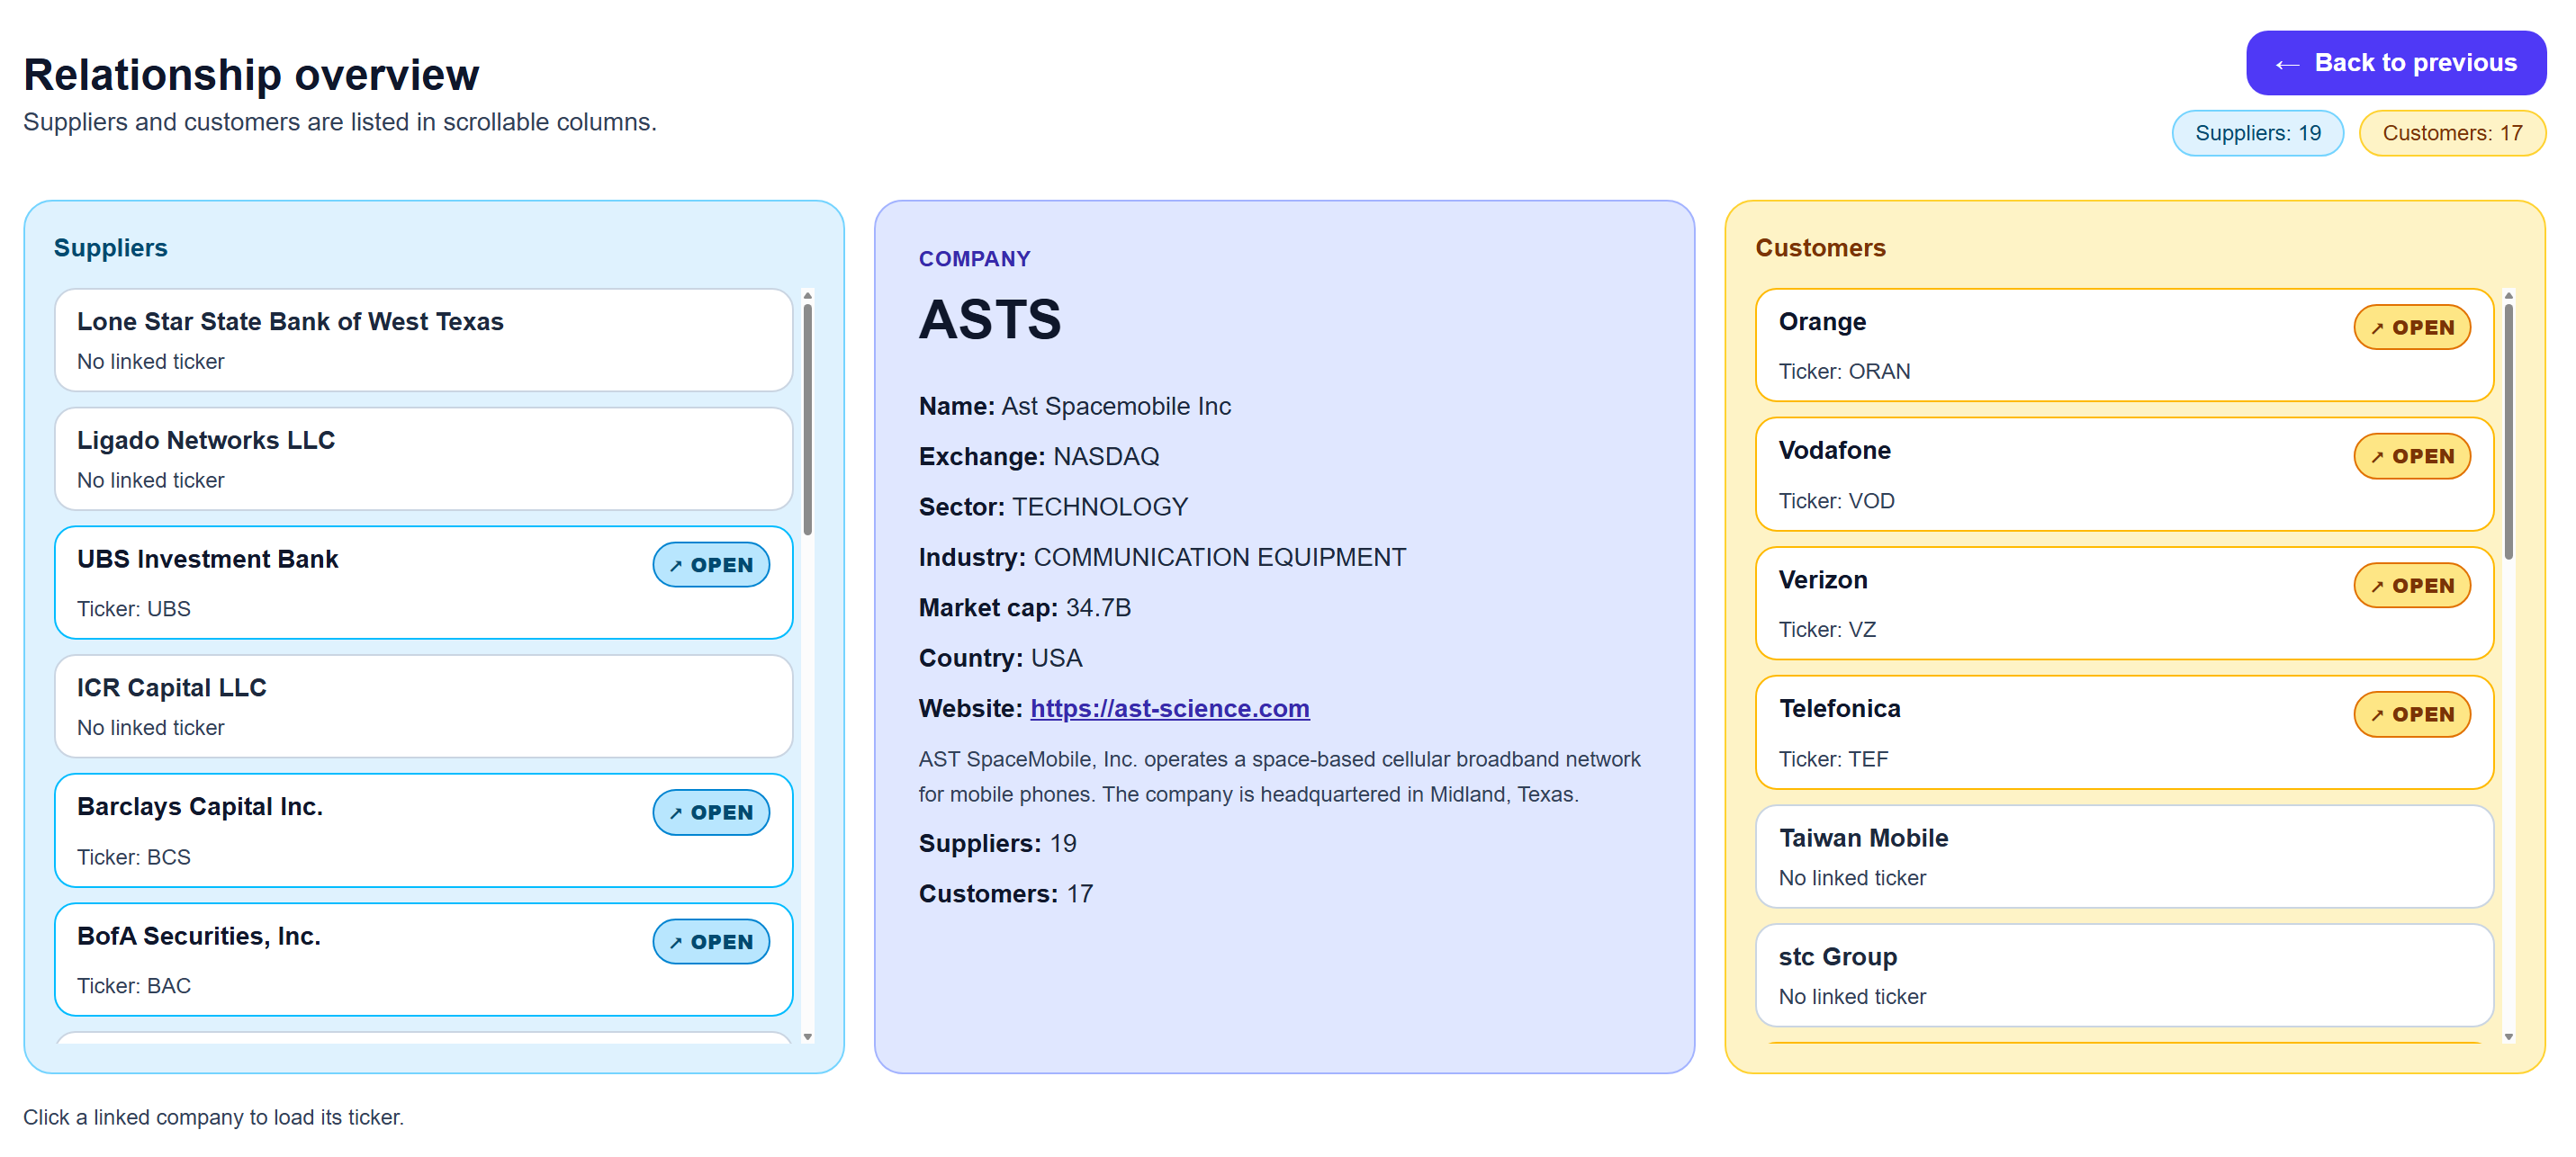
Traversable relationship graph
Click any node to pivot instantly into its upstream suppliers, downstream customers, and adjacent entities. This is where lead discovery and exposure mapping happen fast.
Null Exposure
Null Exposure maps customer, supplier, and ecosystem relationships across thousands of public companies in a traversable graph. Every edge is source-backed so sales teams, investors, and strategy leaders can move from assumption to evidence in minutes.
The interface is built for fast discovery: start with one company, traverse connected nodes, validate each relationship with cited evidence, and layer in operating constraints like geography, spend band, and relationship stage.
Click any node to pivot instantly into its upstream suppliers, downstream customers, and adjacent entities. This is where lead discovery and exposure mapping happen fast.
Every relationship includes source context so teams can defend decisions with evidence from filings, earnings transcripts, and news.
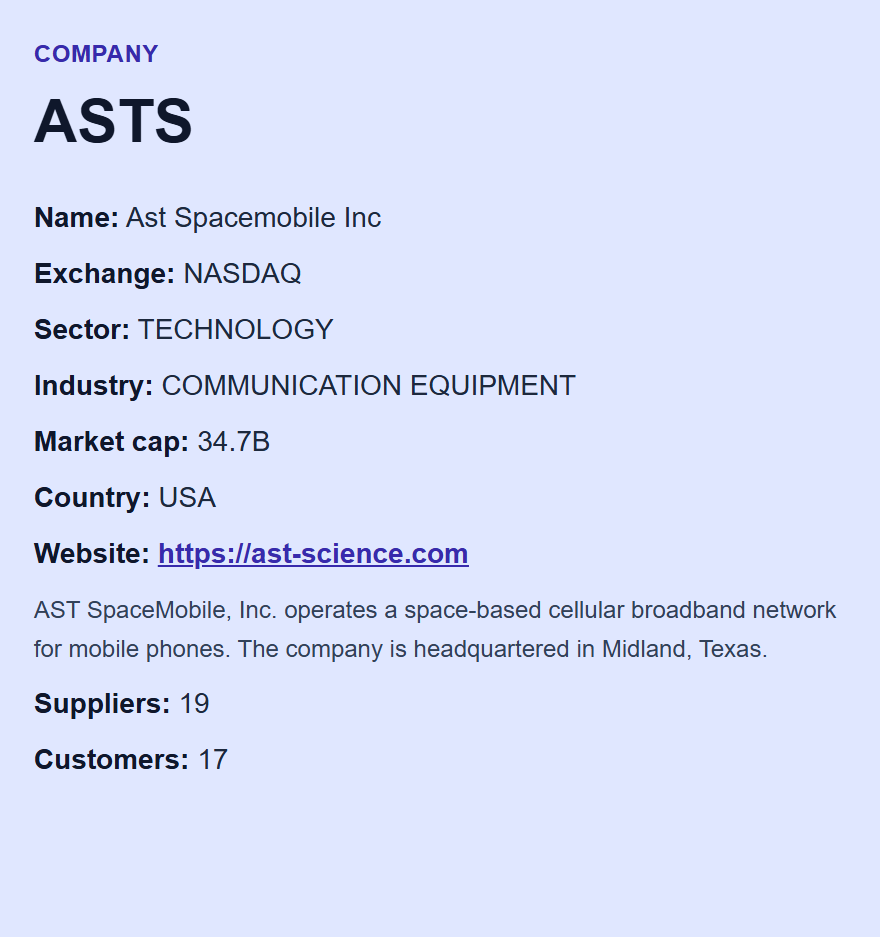
Anchor research with business profile, sector context, and market information before drilling into relationships.
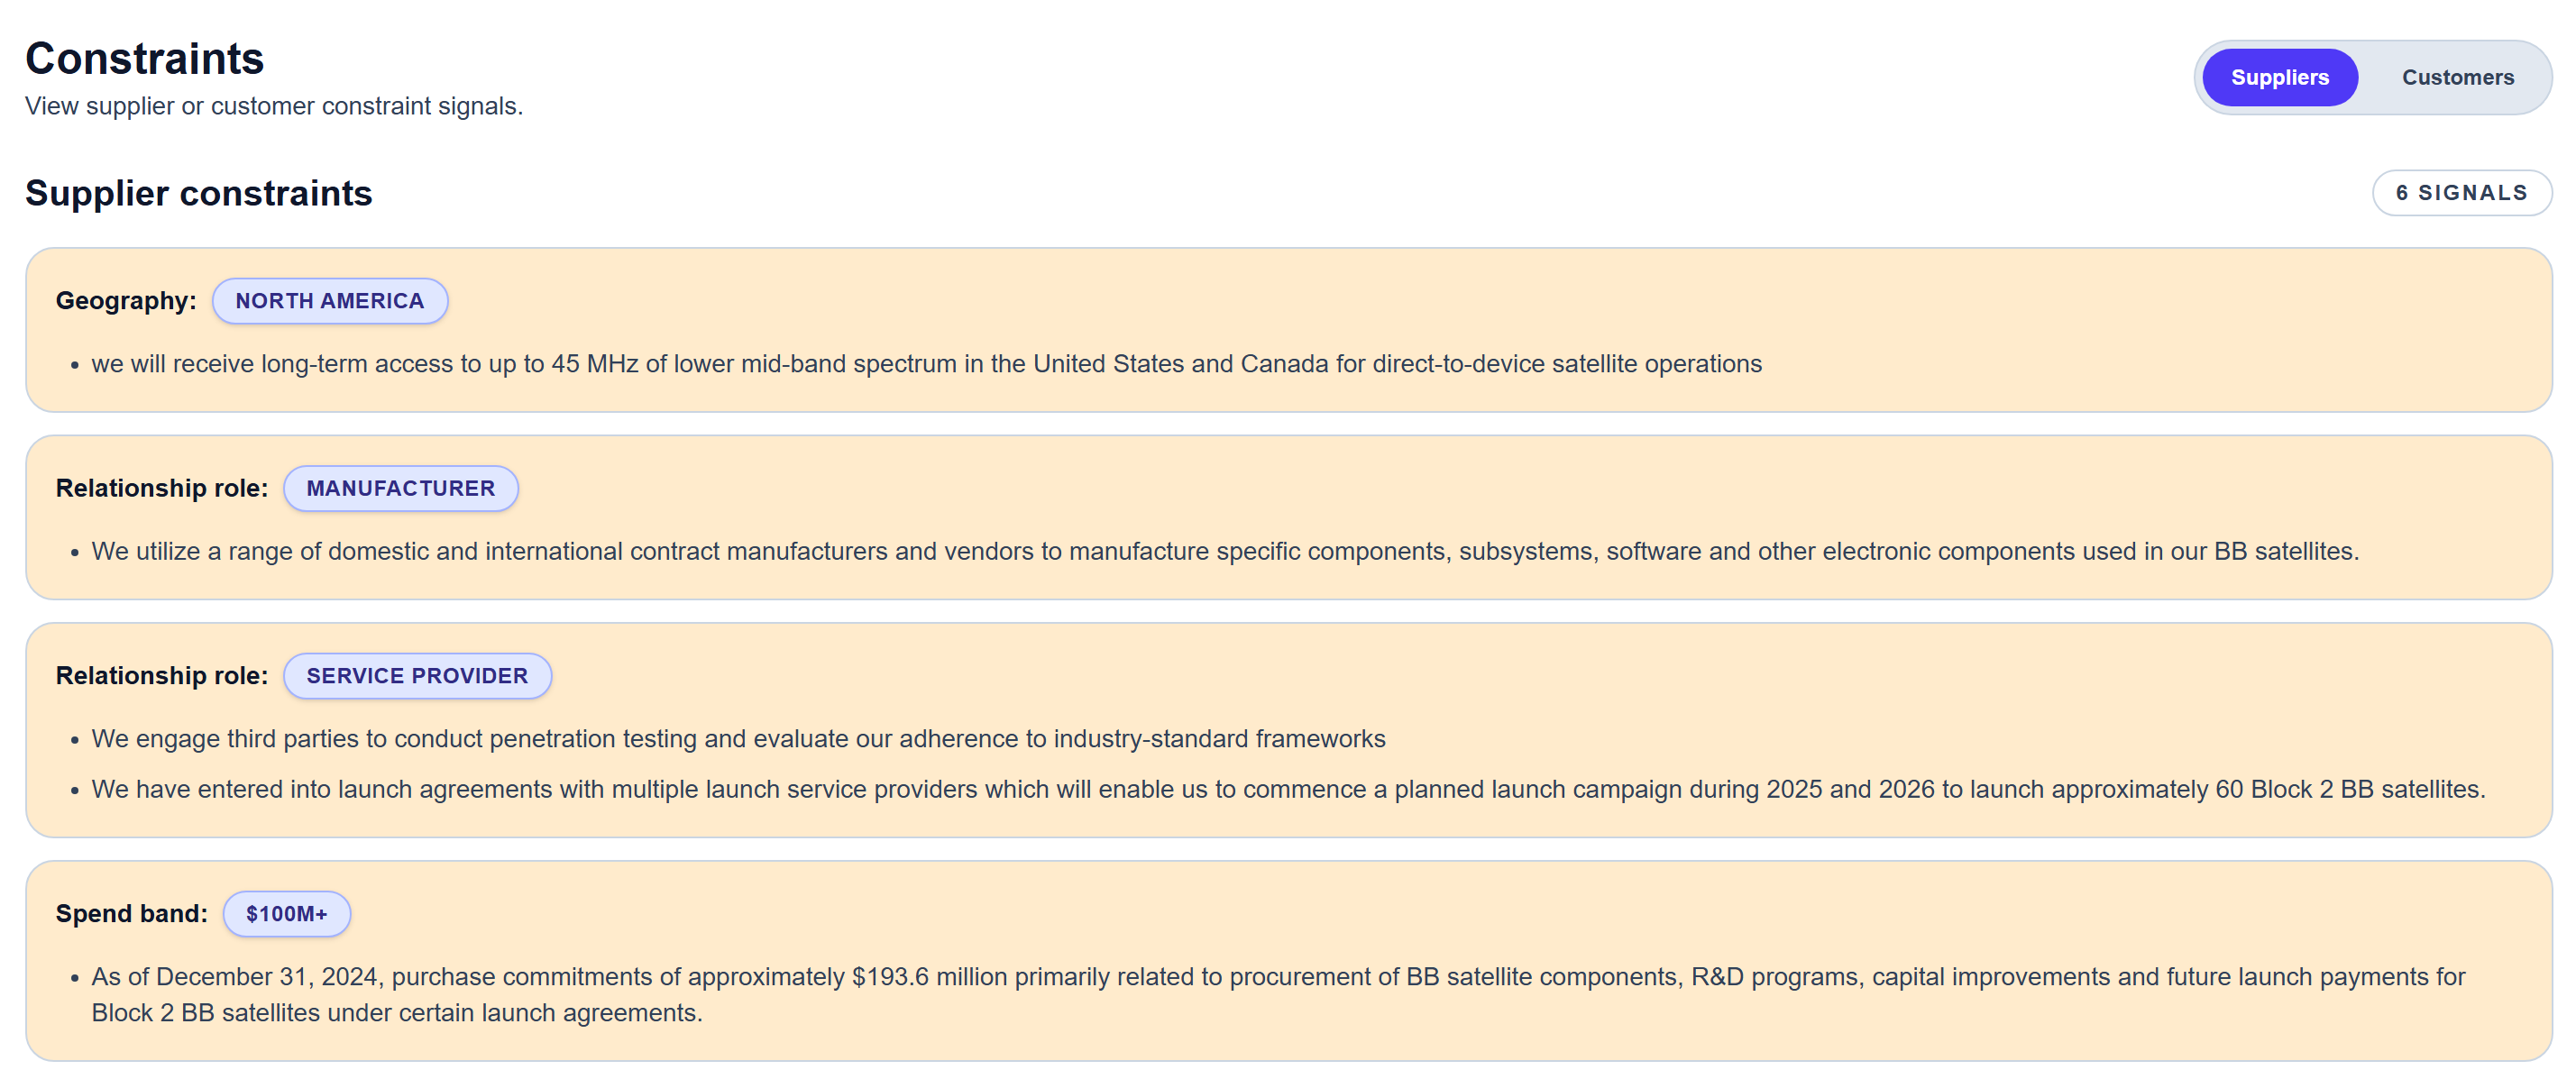
Understand how a company operates through structured signals like geography exposure, contract posture, and spend concentration.
Step 1
Search any public ticker and open its live relationship map.
Step 2
Click suppliers, customers, and adjacent entities to follow commercial pathways.
Step 3
Open cited evidence tied to each relationship before acting.
Step 4
Use operating signals to rank opportunities, risks, and strategic moves.
Move through real company networks interactively to discover second- and third-order opportunities.
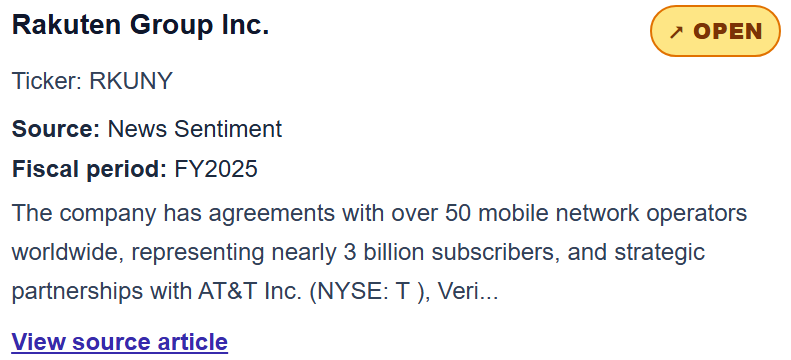
Relationships are auditable with cited sources so teams can verify assumptions before outreach, investment, or strategy decisions.
AI extracts relationship signals from 10-Ks, earnings calls, and news so your team sees what manual research misses.
Replace hours of spreadsheet assembly and fragmented browsing with a single workflow built for speed.
Start with one customer logo, traverse its suppliers and adjacent vendors, and build a higher-conversion account list based on observed buying context.
Outcome: Better targeting, faster qualification, more relevant outreach.
Map dependency chains and customer concentration signals to understand exposure, demand transmission, and second-order effects across portfolios.
Outcome: Faster risk framing and stronger conviction in research notes.
Visualize market ecosystems, competitor dependencies, and partner routes to identify white space, M&A adjacency, and partnership leverage.
Outcome: Clearer ecosystem maps and better strategic prioritization.
Discover who uses which technologies, where infrastructure dependencies cluster, and which companies are best positioned for your product or model.
Outcome: Sharper market positioning and faster opportunity discovery.
Open the graph, validate the evidence, and turn relationship intelligence into pipeline, insight, and strategic advantage.